Presidio County reaches 100% vaccinated. Other counties are plodding along, increasing their fully vaccinated numbers by 1% every month. The border has the highest vaccination rates; however, they also have high per-capita hospitalizations. These have reached Delta-surge levels.
Covid-19 Hospitalizations: The question of whether Texas has peaked is difficult to answer. While the DSHS has implemented additional routers to process the large number of cases faster, what the doctor ordered is fewer hospitalizations. We are not there.

As shown in Figure 1, above, both Central Texas and the Gulf Coast have not exceeded last Summer's Delta Surge. While per-capita Hospitalizations may have plateaued, it is too early to say. Such stretches over time are instead linear, slow increases from one week to the next; these managed increases occur as staffing and ICU capacity permits.


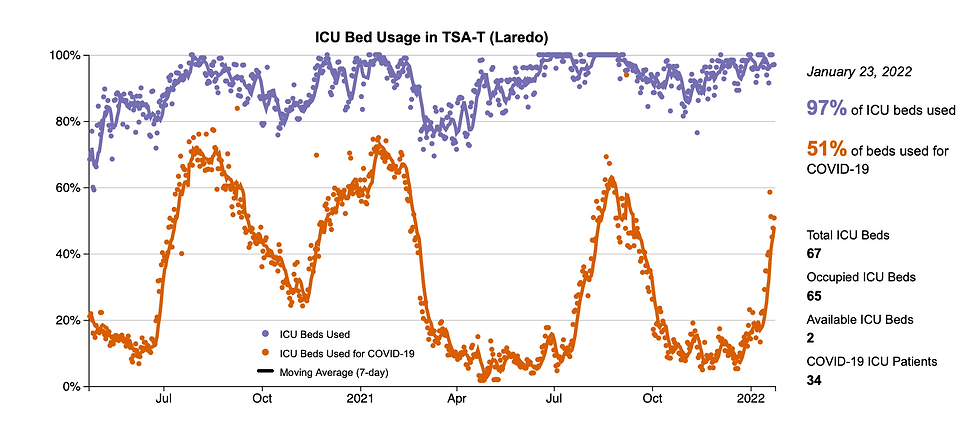
Figures 2a, 2b, and 2c show rising Covid-19 patient demand for ICU beds as Covid-19 Patient-occupied ICU levels reach those obtained during Delta (Waco, Laredo, Bryan/College Station).

Figure 3, above, lists all the TSA's along with Hospitalized Covid-19 Patients by day for Week 96 and 97. TSA-S(Victoria) and H(Lufkin) had 5-day doubling rates during Week 97. Other Service areas increased more slowly (11+ days) or not at all (e.g. El Paso, Houston, Bryan/College Station).

presents overlay of Covid-19 Hospitalizations and Confirmed Cases. One year ago, outside of the Panhandle, we were at peak Hospitalizations; will these go higher during Weeks 98 through 100? Cases will not tell us since they are often reported after the fact and under reported (many tests now over-the-counter at home). This is why I did not bother to adjust the scales. Interestingly, while the Panhandle per-capita numbers come out highest-in-the-state, they are low on an absolute basis.
To answer the question about Weeks 98 through 100, all we need to do is look at where we are in our Vaccination Table, Figure 4. There, we can take the total State population (2019, estimate - not from the Census per Texas DSHS bookkeeping). and subtract those which are completely vaccinated: (27.1M - 16.5M) = 10.6M unvaccinated eligible individuals.

The results are as follows: Central (6.3M - 3.8M) = 2.5M > 2.1M; Gulf Coast (7.9M - 3.8M) = 4.1M >2.1M; North Texas (9.1M - 5.2M) = 3.9M>2.1M; Border (2.5M-1.9M) = .6M < 2.1M; and, Panhandle (1.3M - .6M)=.7M. The next step is to take the result and divide it by the population of the largest county: Central (2.5M/3.1M Bexar+Travis) ~.7, Gulf Coast (4.1M/6) M)~.7, North Texas (3.9/3.1) ~1.3, Border (.6M/1.9)~.5, and Panhandle (.7/.4)~1.8. As you would expect the Panhandle has a small number; but, this result .7M is larger than the population of its largest cities. So, to the extent that all of these people will come into contact with each other, their risk will remain high the longest even though their low population density serves to protect them. Similarly, North Texas population is concentrated in the Dallas/Fort Worth area and the virus will be able to spread here longer than along the Border. Elsewhere, we should get some relief until the next round, in six months.
Six months is the time it takes for the booster effect to wear off. According to the the Texas DSHS, as of Week 97, 5.7M individuals have had boosters. This is roughly one-third of the total population eligible. If these people become preoccupied with Summer Vacation, the 2022 Election, Independence Day Sales, and thus fail to renew their immunity, they will make themselves a target for infection by the next variant (Pi?). With six months from the beginning of February looking like next Summer, get thee to to a Pharmacy for a booster before then.

Comments